Open Your World
Vocabularies Dalam Academic IELTS Writing Task 1 yang Wajib Kamu Tahu
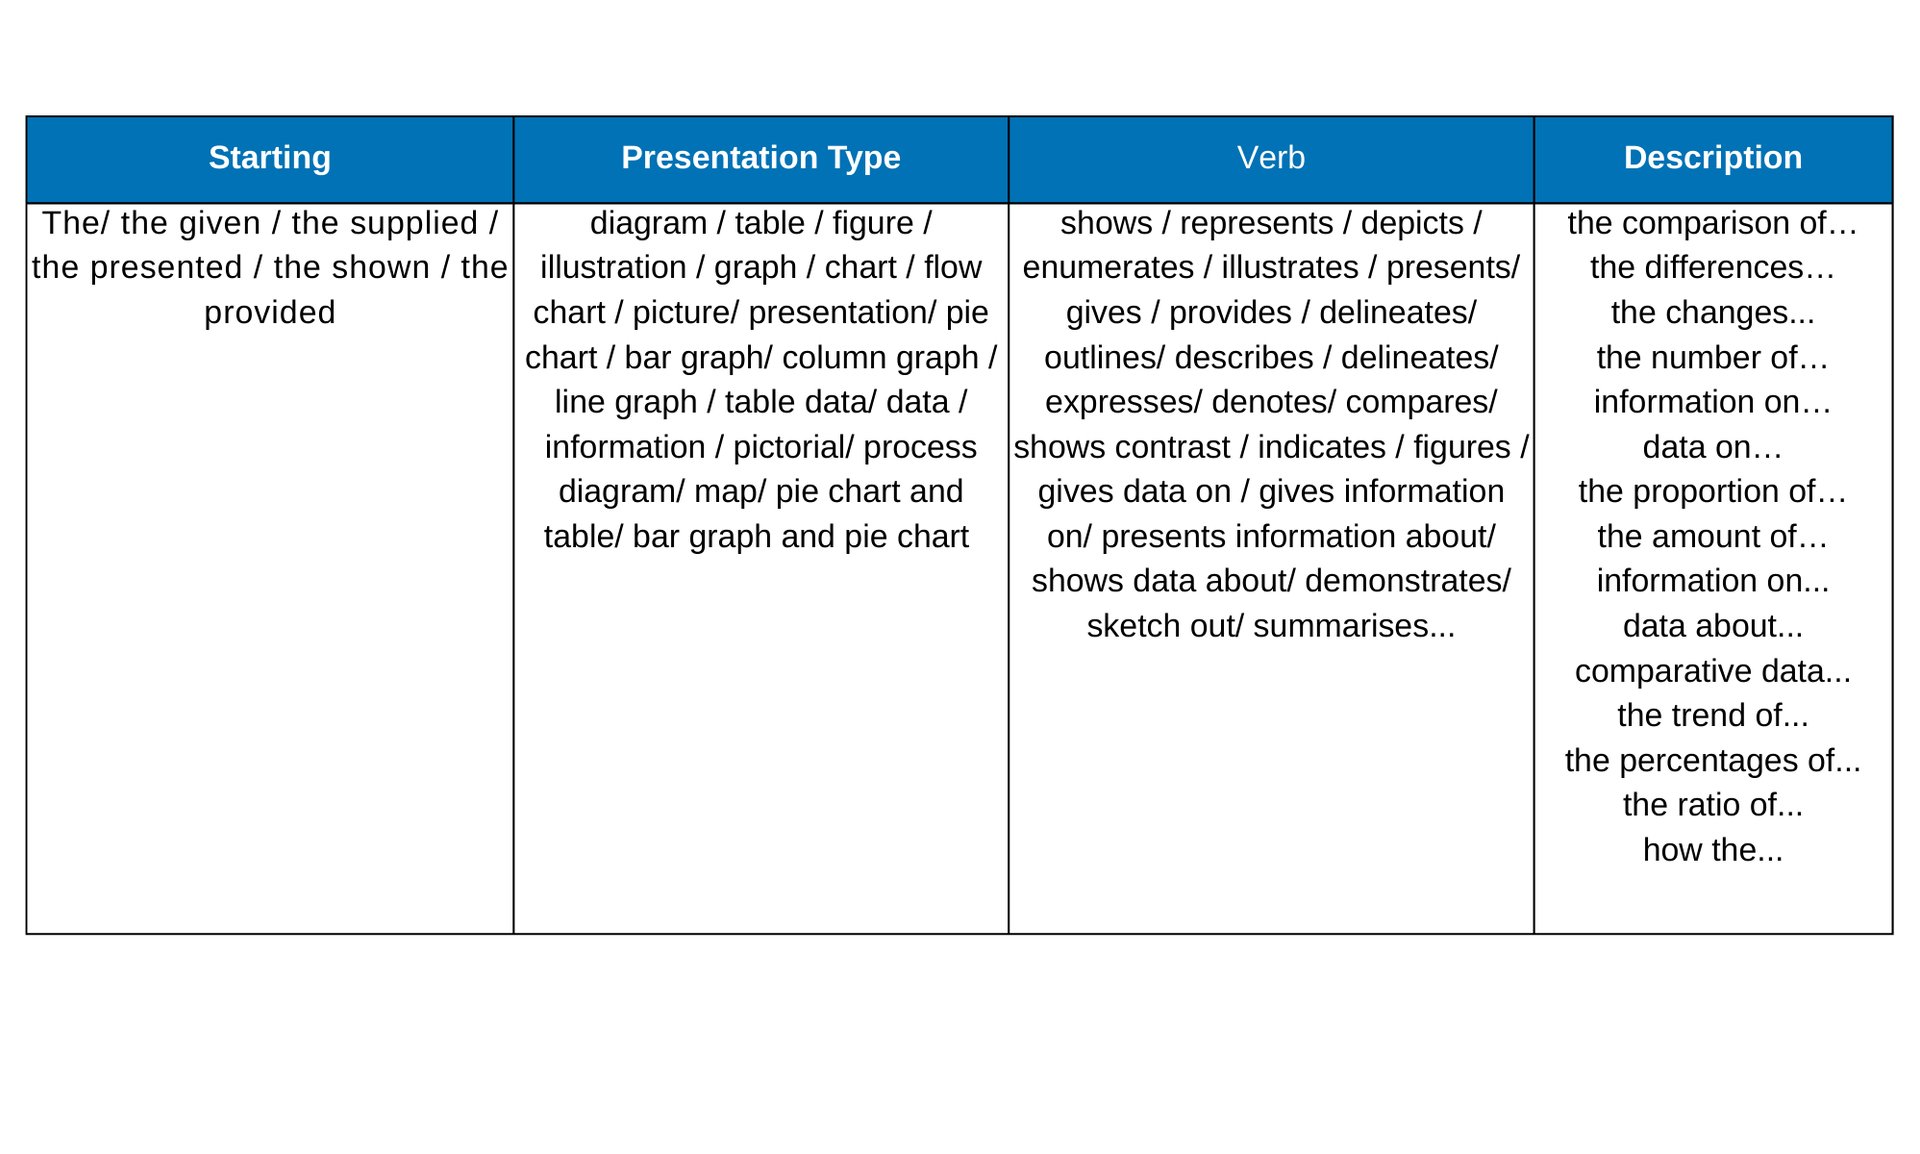
Vocabulary for Academic Writing Task 1
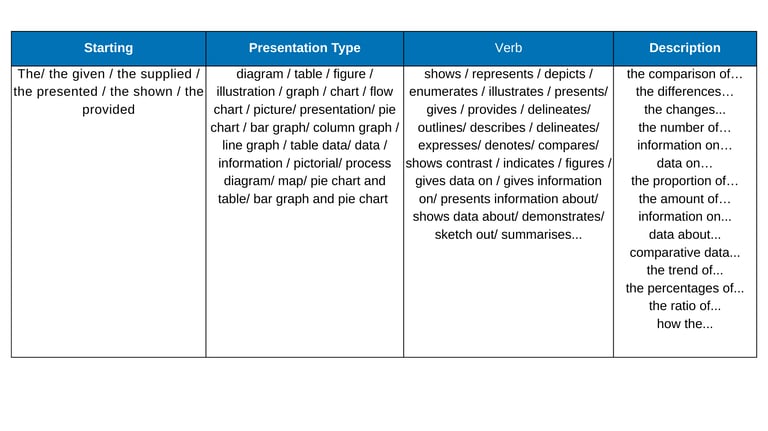
Example :
1. The diagram shows employment rates among adults in four European countries from 1925 to 1985.
2. The given pie charts represent the proportion of male and female employees in 6 broad categories, dividing into manual and non-manual occupations in Australia, between 2010 and 2015.
3. The chart gives information about consumer expenditures on six products in four countries namely Germany, Italy, Britain and France.
4. The supplied bar graph compares the number of male and female graduates in three developing countries while the table data presents the overall literacy rate in these countries.
5. The bar graph and the table data depict the water consumption in different sectors in five regions.
6. The bar graph enumerates the money spent on different research projects while the column graph demonstrates the fund sources over a decade, commencing from 1981.
7. The line graph delineates the proportion of male and female employees in three different sectors in Australia between 2010 and 2015.
Note that, some teachers prefer the "The line graph demonstrates..." instead of "The given line graph demonstrates...". However, if you write "The given/ provided/ presented...." it would be correct as well.
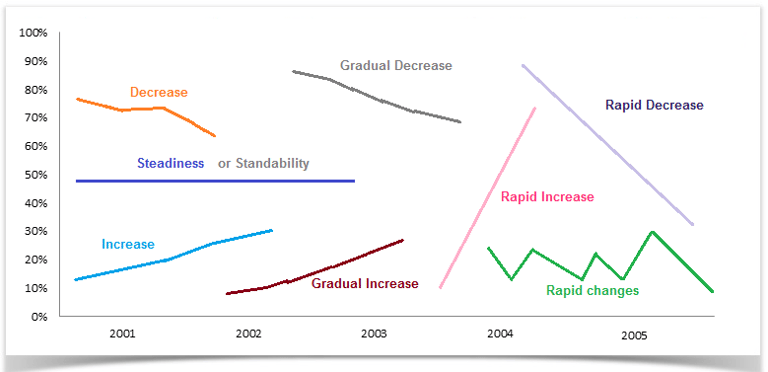
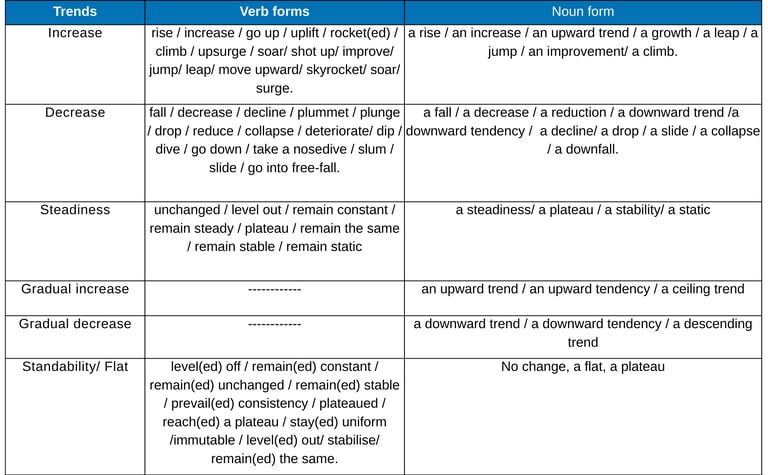
Vocabulary to show the changes

Examples:
1. The overall sale of the company increased by 20% at the end of the year.
2. The expenditure of the office remained constant for the last 6 months but the profit rose by almost 25%.
3. There was a 15% drop in the ratio of student enrollment at this University.
4. The population of the country remained almost the same as it was 2 years ago.
5. The population of these two cities increase significantly in the last two decades and it is expected that it will remain stable during the next 5 years.
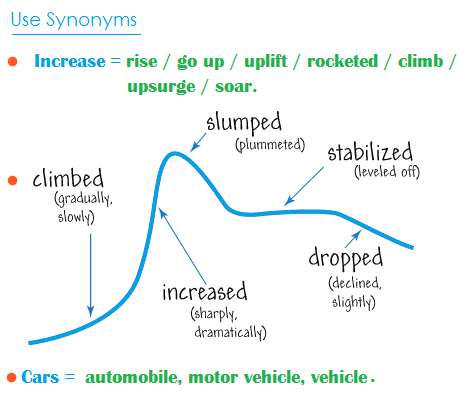
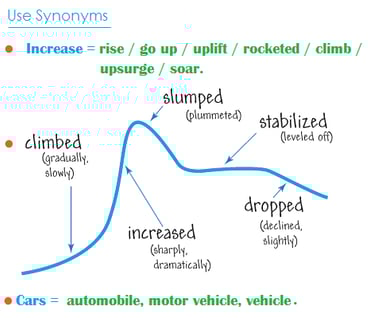
Vocabulary to represents changes in graphs

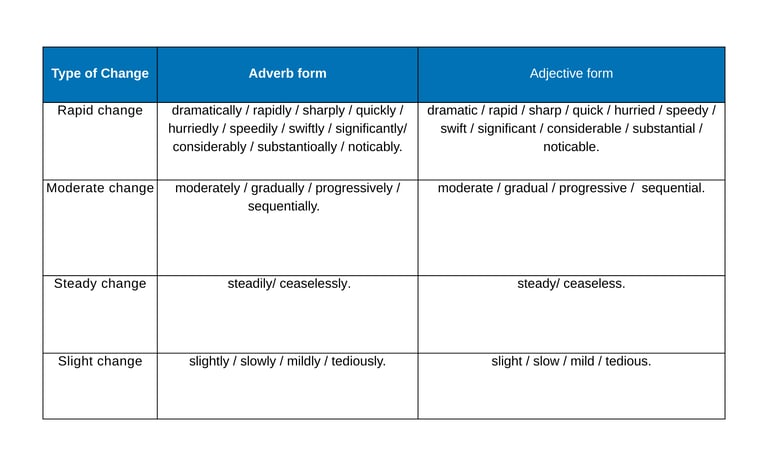
Examples:
1. The economic inflation of the country increased sharply by 20% in 2008.
2. There was a sharp drop in industrial production in the year 2009.
3. The demand for new houses dramatically increased in 2002.
4. The population of the country dramatically increased in the last decade.
5. The price of oil moderately increased during the last quarter but as a consequence, the price of daily necessities rapidly went up.
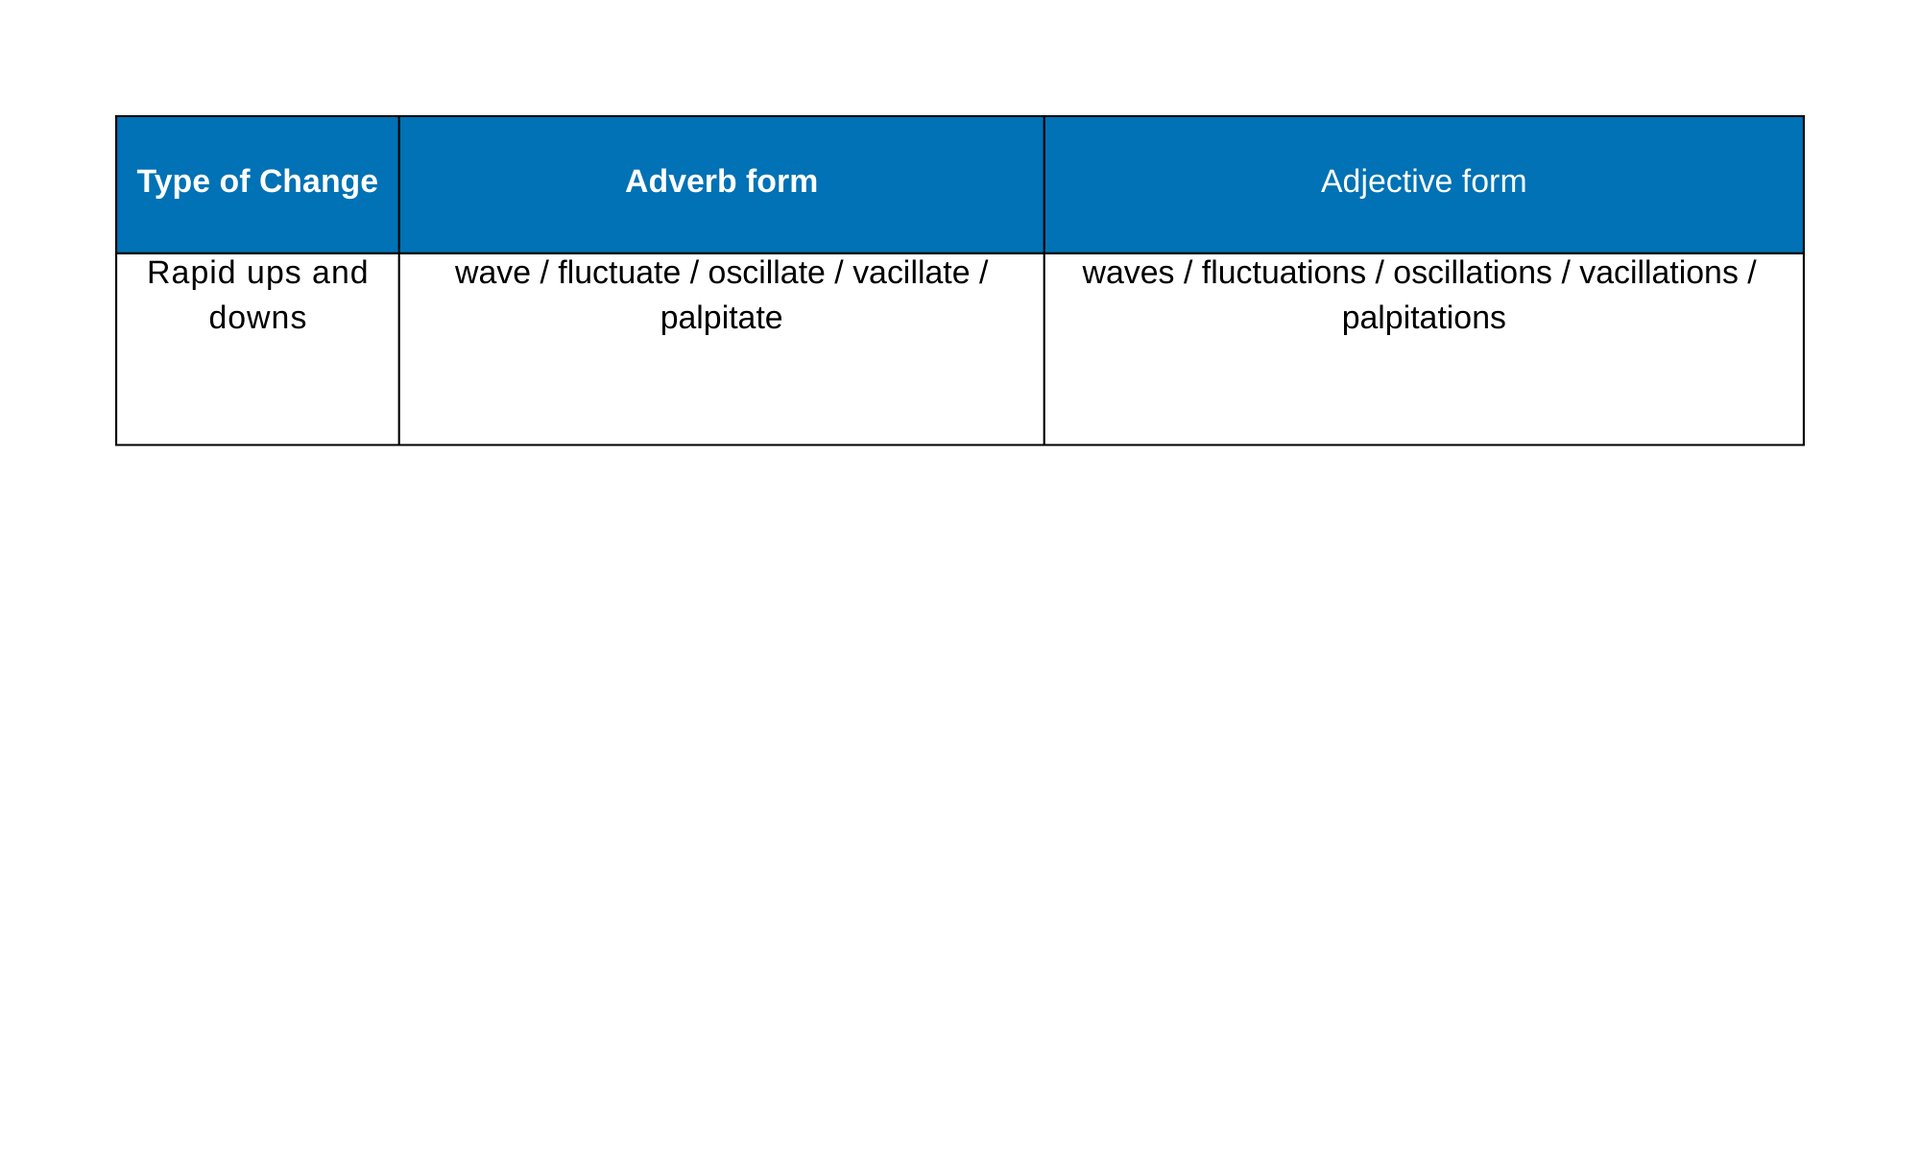
Vocabulary to represent frequent changes in graphs:
Example:
1. The price of the goods fluctuated during the first three months of 2017.
2. The graph shows the oscillations of the price from 1998 to 2002.
3. The passenger number in this station oscillates throughout the day and in the early morning and evening, it remains busy.
4. The changes in car production in Japan shows a palpitation for the second quarter of the year.
5. The number of students in debate clubs fluctuated in different months of the year and rapid ups and downs could be observed in the last three months of this year.
Dates, Months & Years related vocabulary and grammar:
» From 1990 to 2000, Commencing from 1980, Between 1995 and 2005, After 2012.
» By 1995, In 1998, In February, Over the period, During the period, During 2011.
» In the first half of the year, For the first quarter, The last quarter of the year, During the first decade.
» In the 80s, In the 1980s, During the next 6 months, In the mid-70s, Next 10 years, Previous year, Next year, Between 1980 - 1990.
» Within a time span of ten years, within five years.
» Next month, Next quarter, Next year, Previous month, Previous year.
» Since, Then, From
Percentage, Portion and Numbers:
Percentages:
10% increase, 25 percent decrease, increased by 15%, dropped by 10 per cent, fall at 50%, reached to 75%, tripled, doubled, one-fourth, three-quarters, half, double fold, treble, 5 times higher, 3 timers lower, declined to about 49%, stood exactly at 43%.
Fractions:
4% = A tiny fraction.
24% = Almost a quarter.
25% Exactly a quarter.
26% = Roughly one quarter.
32% Nearly one-third, nearly a third.
49% = Around a half, just under a half.
50% Exactly a half.
51% = Just over a half.
73% = Nearly three quarters.
77% = Approximately three quarter, more than three-quarter.
79% = Well over three quarters.
Proportions:
2% = A tiny portion, a very small proportion.
4% = An insignificant minority, an insignificant proportion.
16% = A small minority, a small portion.
70% = A large proportion.
72% = A significant majority, A significant proportion.
89% = A very large proportion.
Words/ Phrases of Approximation - Vocabulary:
» Approximately » Nearly
» Roughly » Almost
» About » Around
» More or less » Just over
» Just under » Just around
» Just about » Just below
» A little more than » A little less than.